Sales Data and Targeted Marketing
Companies often have sales reports produced weekly and monthly. This gives them an idea of how the business is doing.
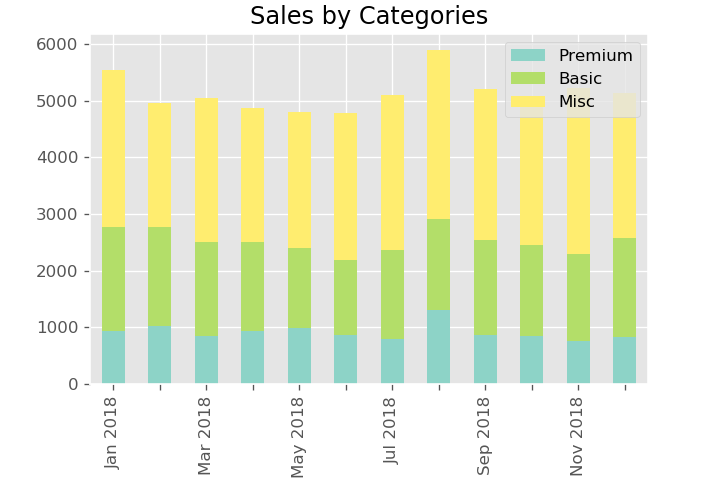
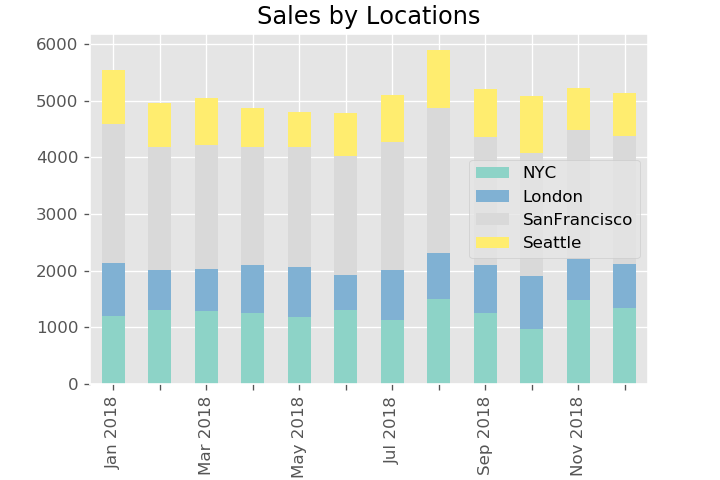
Let us take the example of a company that rents out co-working space to startups and creative types. Their sales report might contain the following graphs where the sales figures are broken down into different categories or geographical locations.


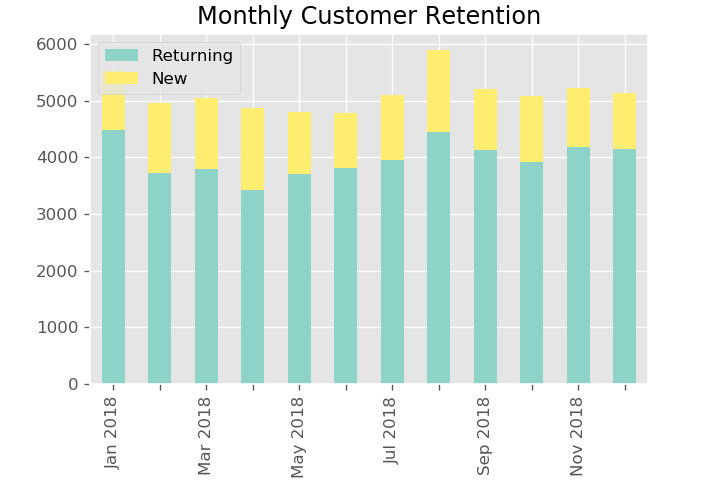
So what can we offer that is superior? The above graphs are basic representations of the sales data. There are other metrics that are more indicative of consumer behavior. One such measure is customer retention. How many of last month’s customers returned this month? If the rate is low, this could indicate problems as the business is struggling to retain customers. The graph below shows what it might look like.

From the graph above, a marketing executive might want to boost the sales in Spring by sending out promotional discount codes to customers who have used their premium services in January or February but hasn’t bought anything in March. Of course, we can do it at an even more granular level such as looking into past purchases and issuing coupons for specific retail categories. All these can be automated and run on databases with millions of customers.
To sum it up, we can work with you to produce a customer-centric reports with consumer-behaviour analytics that can inform your marketing strategy. Once you decide on the approach based on your domain knowledge, we can construct targeted marketing processes that will implement your strategy. Talk to us, work with us and grow your customer base.
